matplotlib是python的一个很好的绘图包,但是其本身并不支持中文(貌似其默认配置中没有中文字体),所以如果绘图中出现了中文,就会出现乱码
Matplotlib是Python的一个很好的绘图包,但是其本身并不支持中文(貌似其默认配置中没有中文字体),所以如果绘图中出现了中文,就会出现乱码。
matplotlib绘制图像有中文标注时会有乱码问题。

实例代码:

SV-Cart网店系统
下载
SV-Cart是开源的电子商务平台。多语言,国际化SV-CART网店系统是一套可以支持各个国家的语言显示的国际电子商务系统,现已支持中文简体、英文、日文、德文和法文,土耳其文,可实现这五种语言在同一平台上的相互转换。免费、开源SV-CART网店系统是一项新的专业开放源代码的WEB2.0网上商城系统,是一套集网上购物和网站内容管理于一体的电子商务解决方案。易操作、多功能SV-CART系统注重操作上的
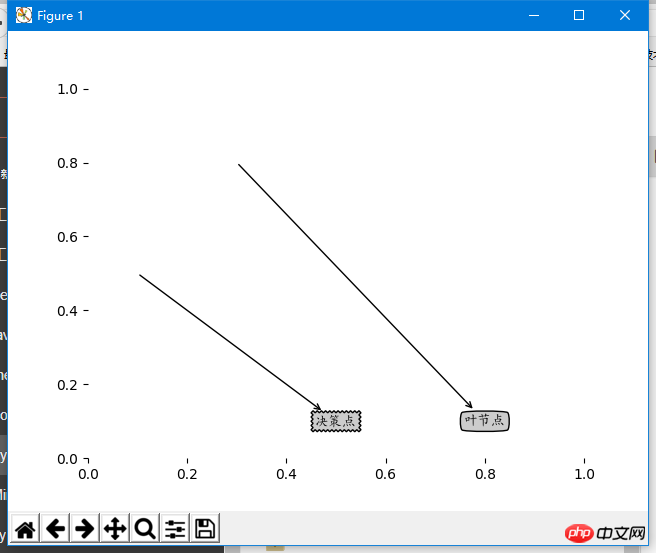
import matplotlib
import matplotlib.pyplot as plt

#定义文本框和箭头格式
decisionNode =dict(boxstyle="sawtooth",fc="0.8")
leafNode=dict(boxstyle="round4",fc="0.8")
arrow_args=dict(arrowstyle="<-")

#绘制带箭头的注解
def plotNode(nodeTxt,centerPt,parentPt,nodeType):
  createPlot.axl.annotate(nodeTxt,xy=parentPt,xycoords='axes fraction',xytext=centerPt,textcoords='axes fraction',va="center",ha="center",bbox=nodeType,arrowprops=arrow_args)

def createPlot():
  fig =plt.figure(1,facecolor='white')
  fig.clf()
  createPlot.axl=plt.subplot(111,frameon=False)
  plotNode(U'决策点',(0.5,0.1),(0.1,0.5),decisionNode)
  plotNode(U'叶节点',(0.8,0.1),(0.3,0.8),leafNode)
  plt.show()
解决办法:代码中引入字体
立即学习“Python免费学习笔记(深入)”;
import matplotlib.pyplot as plt
import matplotlib

#定义自定义字体,文件名是系统中文字体
myfont = matplotlib.font_manager.FontProperties(fname='C:/Windows/Fonts/simkai.ttf')
#解决负号'-'显示为方块的问题
matplotlib.rcParams['axes.unicode_minus']=False

decisionNode =dict(boxstyle="sawtooth",fc="0.8")
leafNode=dict(boxstyle="round4",fc="0.8")
arrow_args=dict(arrowstyle="<-")

def plotNode(nodeTxt,centerPt,parentPt,nodeType):
  createPlot.axl.annotate(nodeTxt,xy=parentPt,xycoords='axes fraction',xytext=centerPt,textcoords='axes fraction',va="center",ha="center",bbox=nodeType,arrowprops=arrow_args,fontproperties=myfont)

def createPlot():
  fig =plt.figure(1,facecolor='white')
  fig.clf()
  createPlot.axl=plt.subplot(111,frameon=False)
  plotNode(U'决策点',(0.5,0.1),(0.1,0.5),decisionNode)
  plotNode(U'叶节点',(0.8,0.1),(0.3,0.8),leafNode)
  plt.show()